Dashboard
View organisation-wide activity across documents, change requests, and requests for information in configurable KPI tiles, charts, and tables, switch between the General Dashboard and the Change Request Dashboard, and customise the layout to suit how you work.
Overview
Select Dashboard in the main menu when your organisation has the dashboard enabled. A selector at the top lets you choose General Dashboard or Change Request Dashboard, and a Customise button unlocks the layout, covered in Customising the Layout below. A "Loading…" indicator appears while data is being fetched, and any error appears in a banner above the rows.
Which rows and tiles you see depends on your organisation's settings and your own access rights, so your dashboard may not show every row described on this page.
Any layout changes you make are stored in your browser rather than on your account, so they do not follow you to another computer; see Customising the Layout below.
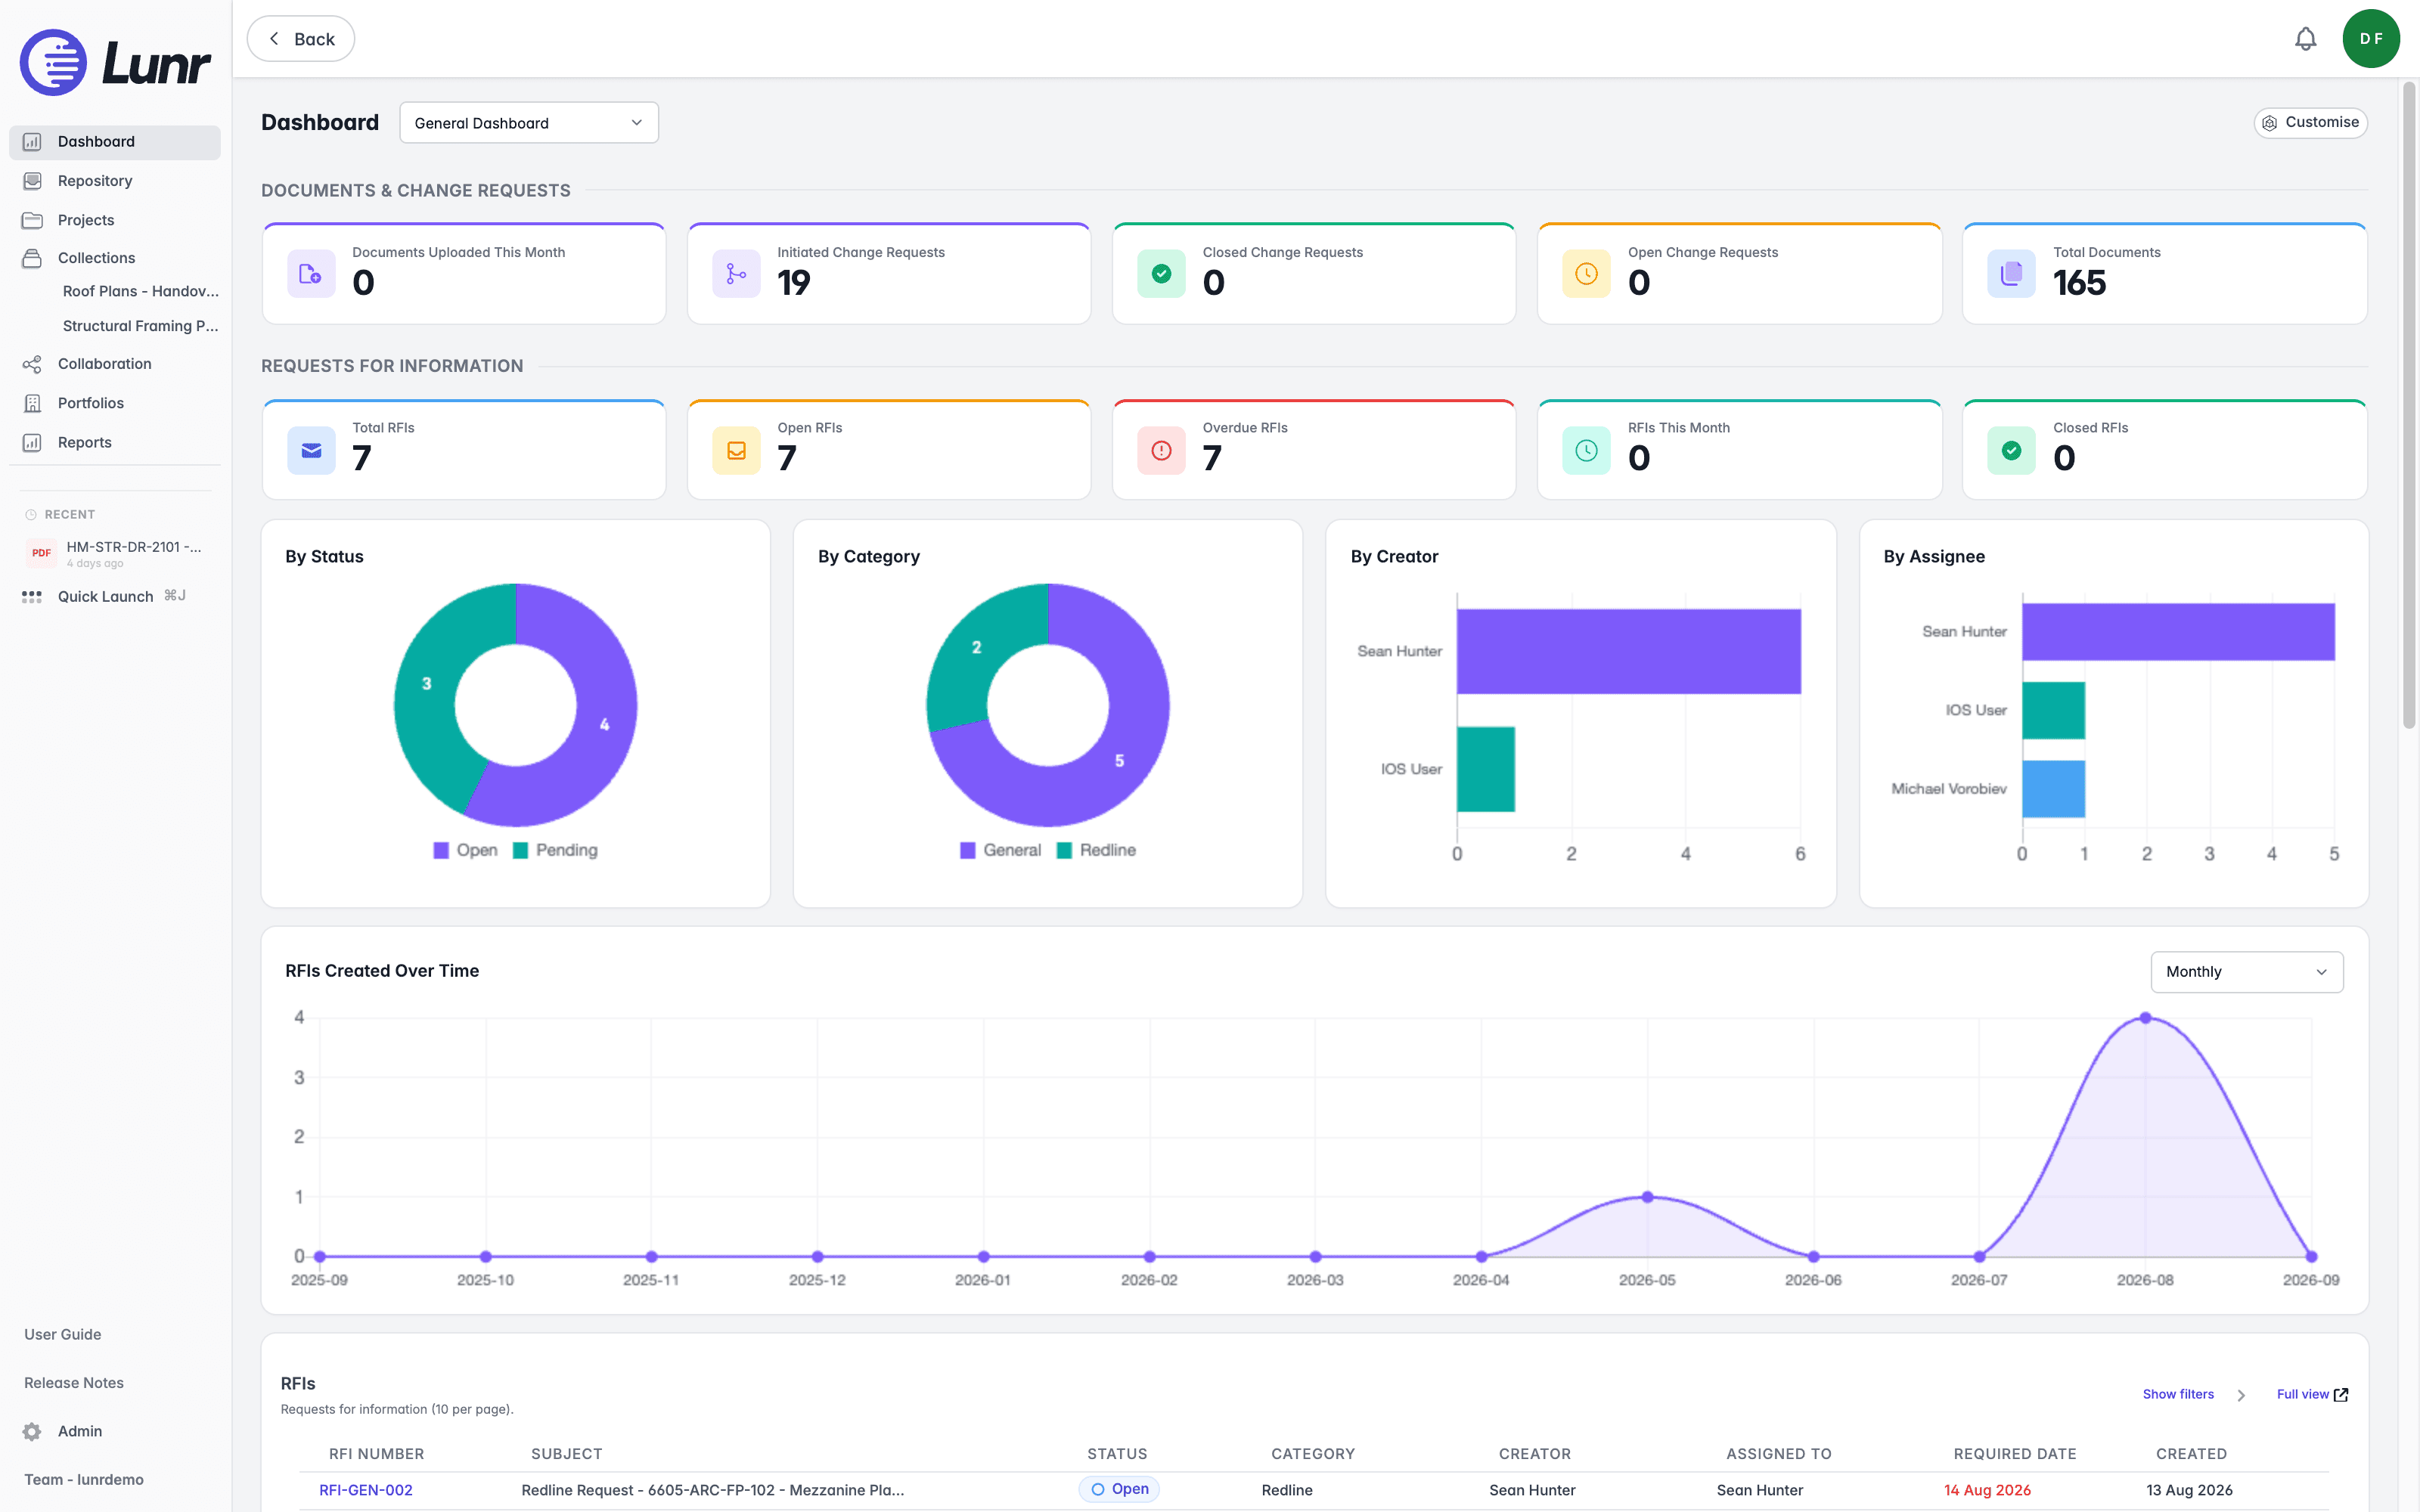
General Dashboard
The General Dashboard opens on a Documents & Change Requests band with five KPI tiles: Documents Uploaded This Month, Initiated Change Requests, Closed Change Requests, Open Change Requests, and Total Documents.
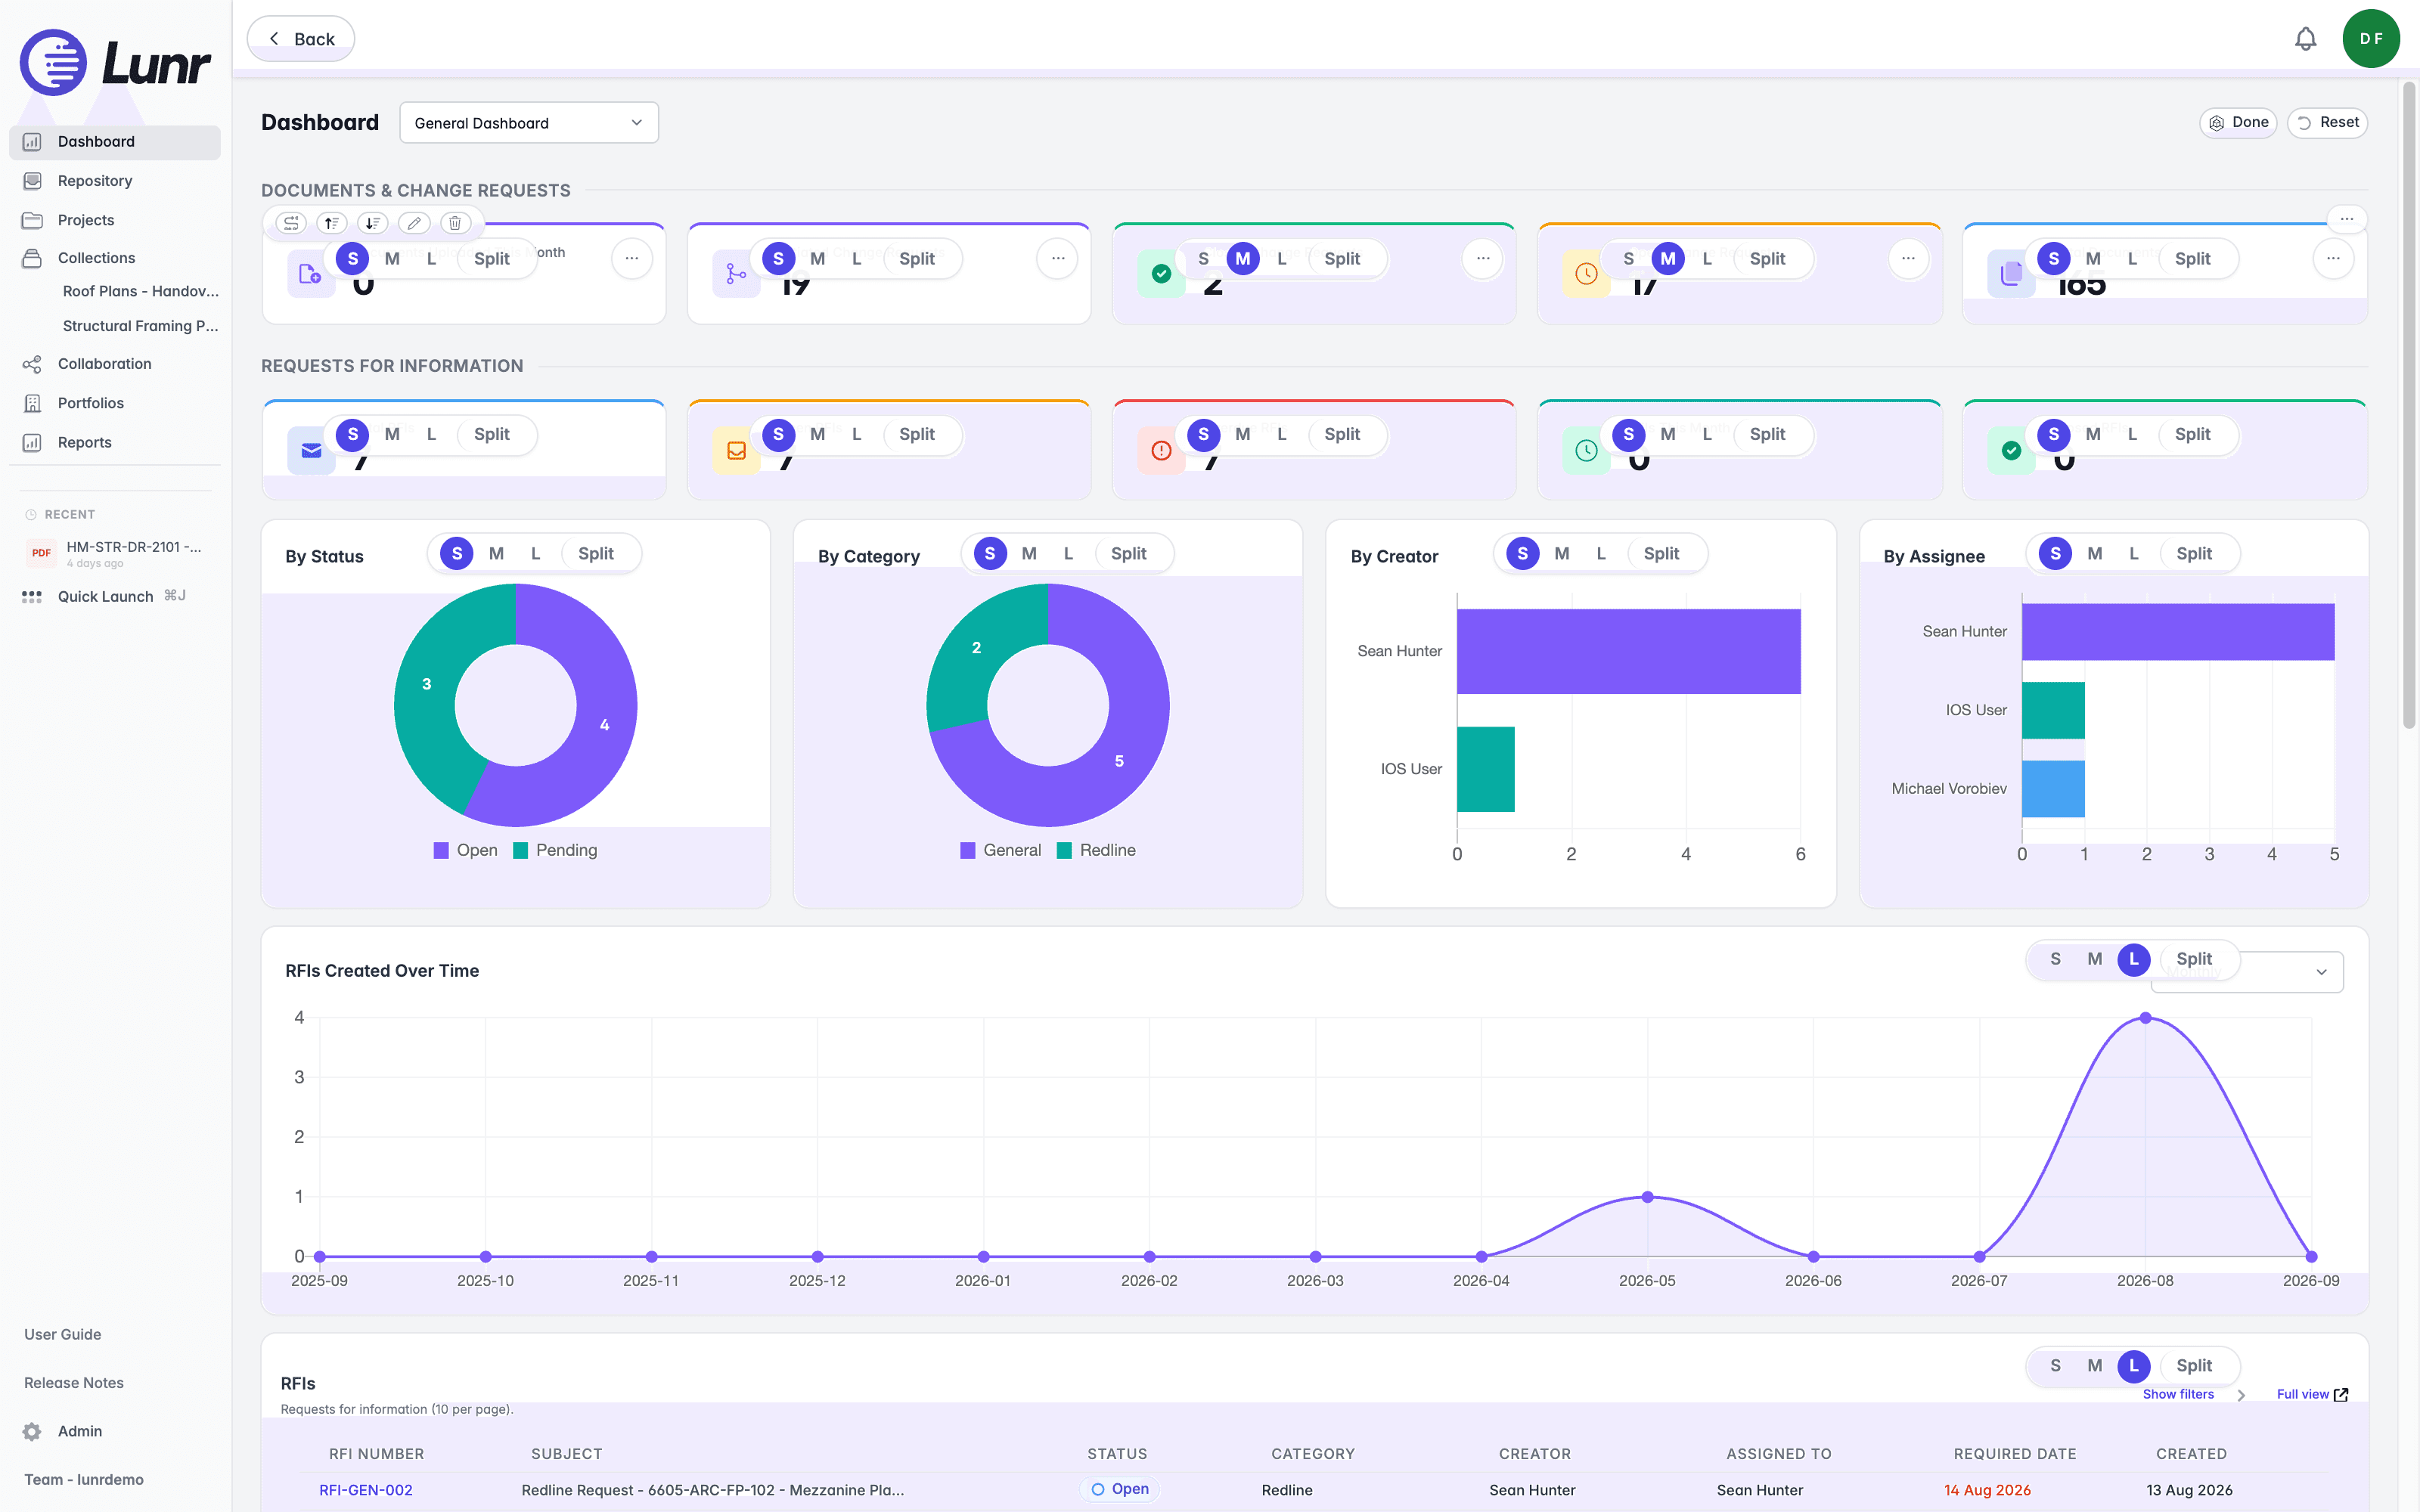
Below it, a Requests for Information band shows five more KPI tiles: Total RFIs, Open RFIs, Overdue RFIs, RFIs This Month, and Closed RFIs. Four RFI charts follow: By Status, By Category, By Creator, and By Assignee, then RFIs Created Over Time, which you can aggregate by Daily, Weekly, Monthly, or Yearly.
An RFIs list follows, described as "Requests for information (10 per page)." Use Show filters or Hide filters to narrow it, and select Full view to open the full list in the Collaboration area. Its columns are RFI Number, Subject, Status, Category, Creator, Assigned To, Required Date, and Created, with paging reading, for example, "Showing 1-7 of 7" alongside Previous and Next buttons.
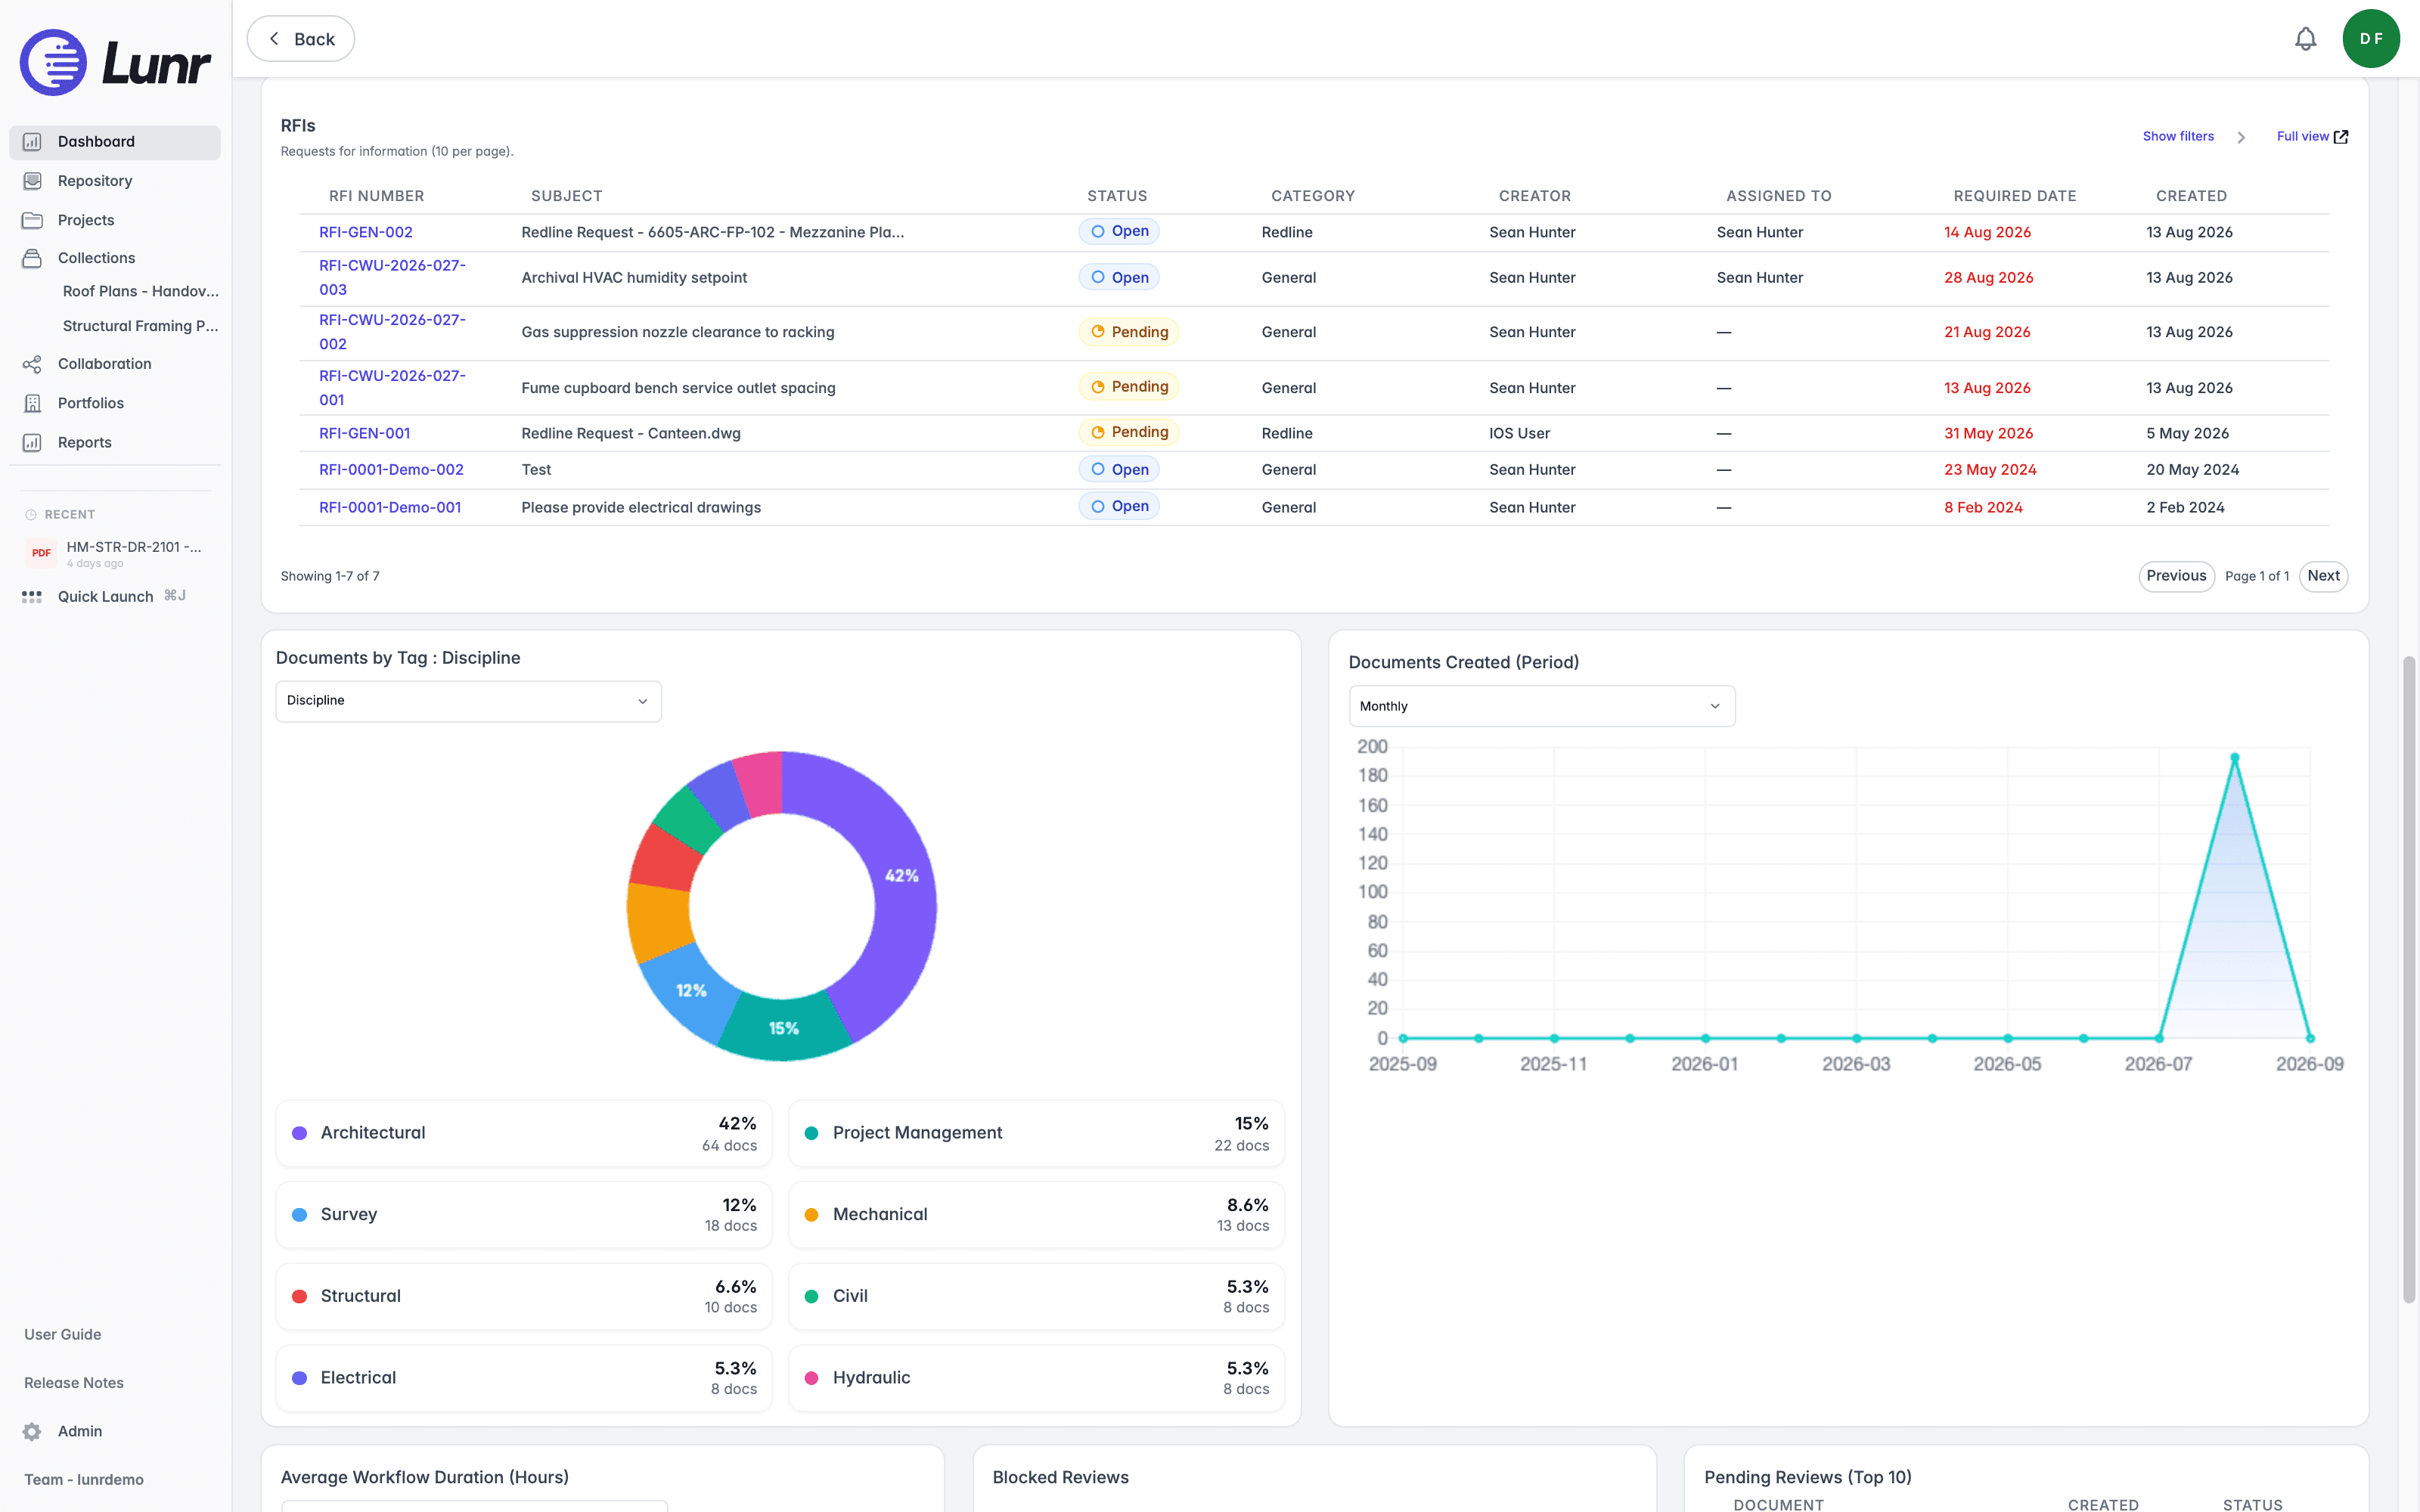
A Documents by Tag chart follows, with its heading extended by the tag you choose, for example "Documents by Tag : Discipline". Choose from your organisation's own tag definitions. Each row shows the tag value, a percentage, and a document count, for example "64 docs".
Documents Created (Period) and Average Workflow Duration (Hours) follow, each with its own aggregation of Daily, Weekly, or Monthly.
Blocked Reviews lists reviews that cannot proceed, reading "No blocked reviews." when there are none. Pending Reviews (Top 10) lists documents awaiting review with Document, Created, and Status columns, reading "No pending reviews." when there are none.
A My Saved Reports row can also appear, described as "Quick access to your saved filter views."
Change Request Dashboard
Choose Change Request Dashboard from the selector to switch views. It opens on an All Time KPI band showing Initiated Change Requests, Closed Change Requests, Open Change Requests, and Queued Drawings, followed by a This Week band showing Initiated, Updated, and Closed counts.
A Filters row lets you narrow every widget below it by period, using This Month, Last 30 Days, Last 90 Days, This Year, or All Time, alongside a Status choice of All, Open, or Completed, a From and To date, and a Reset button.
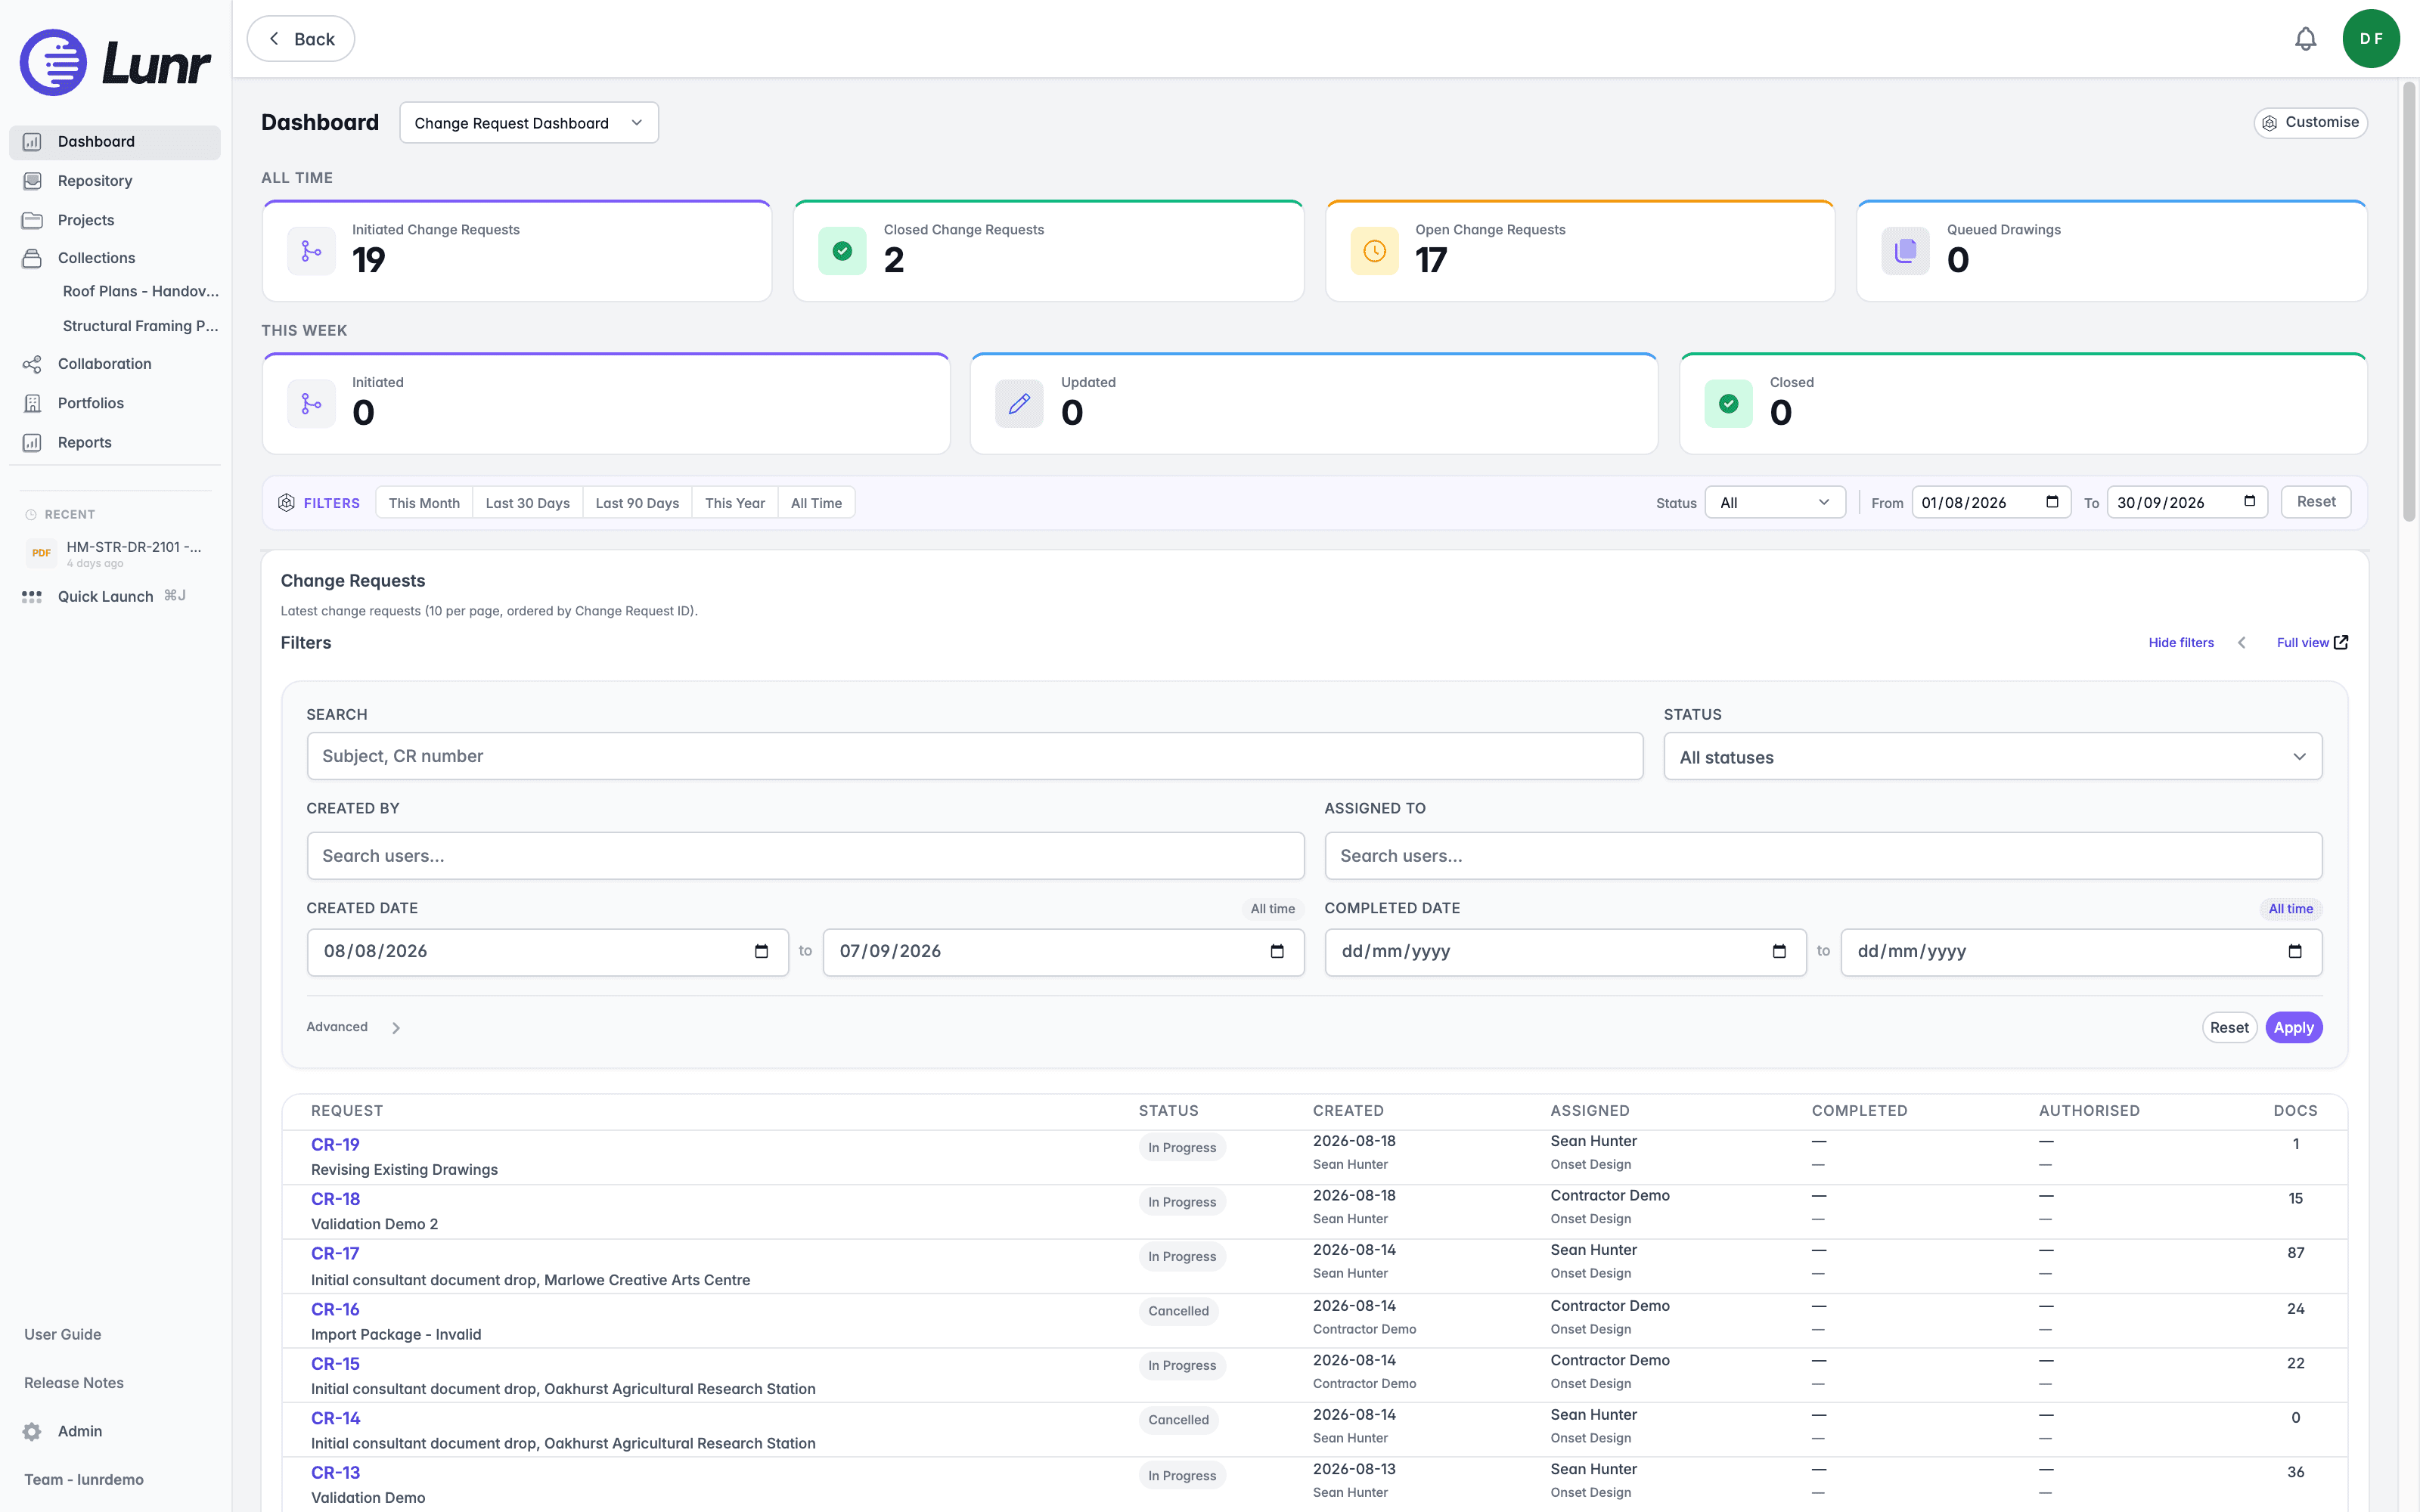
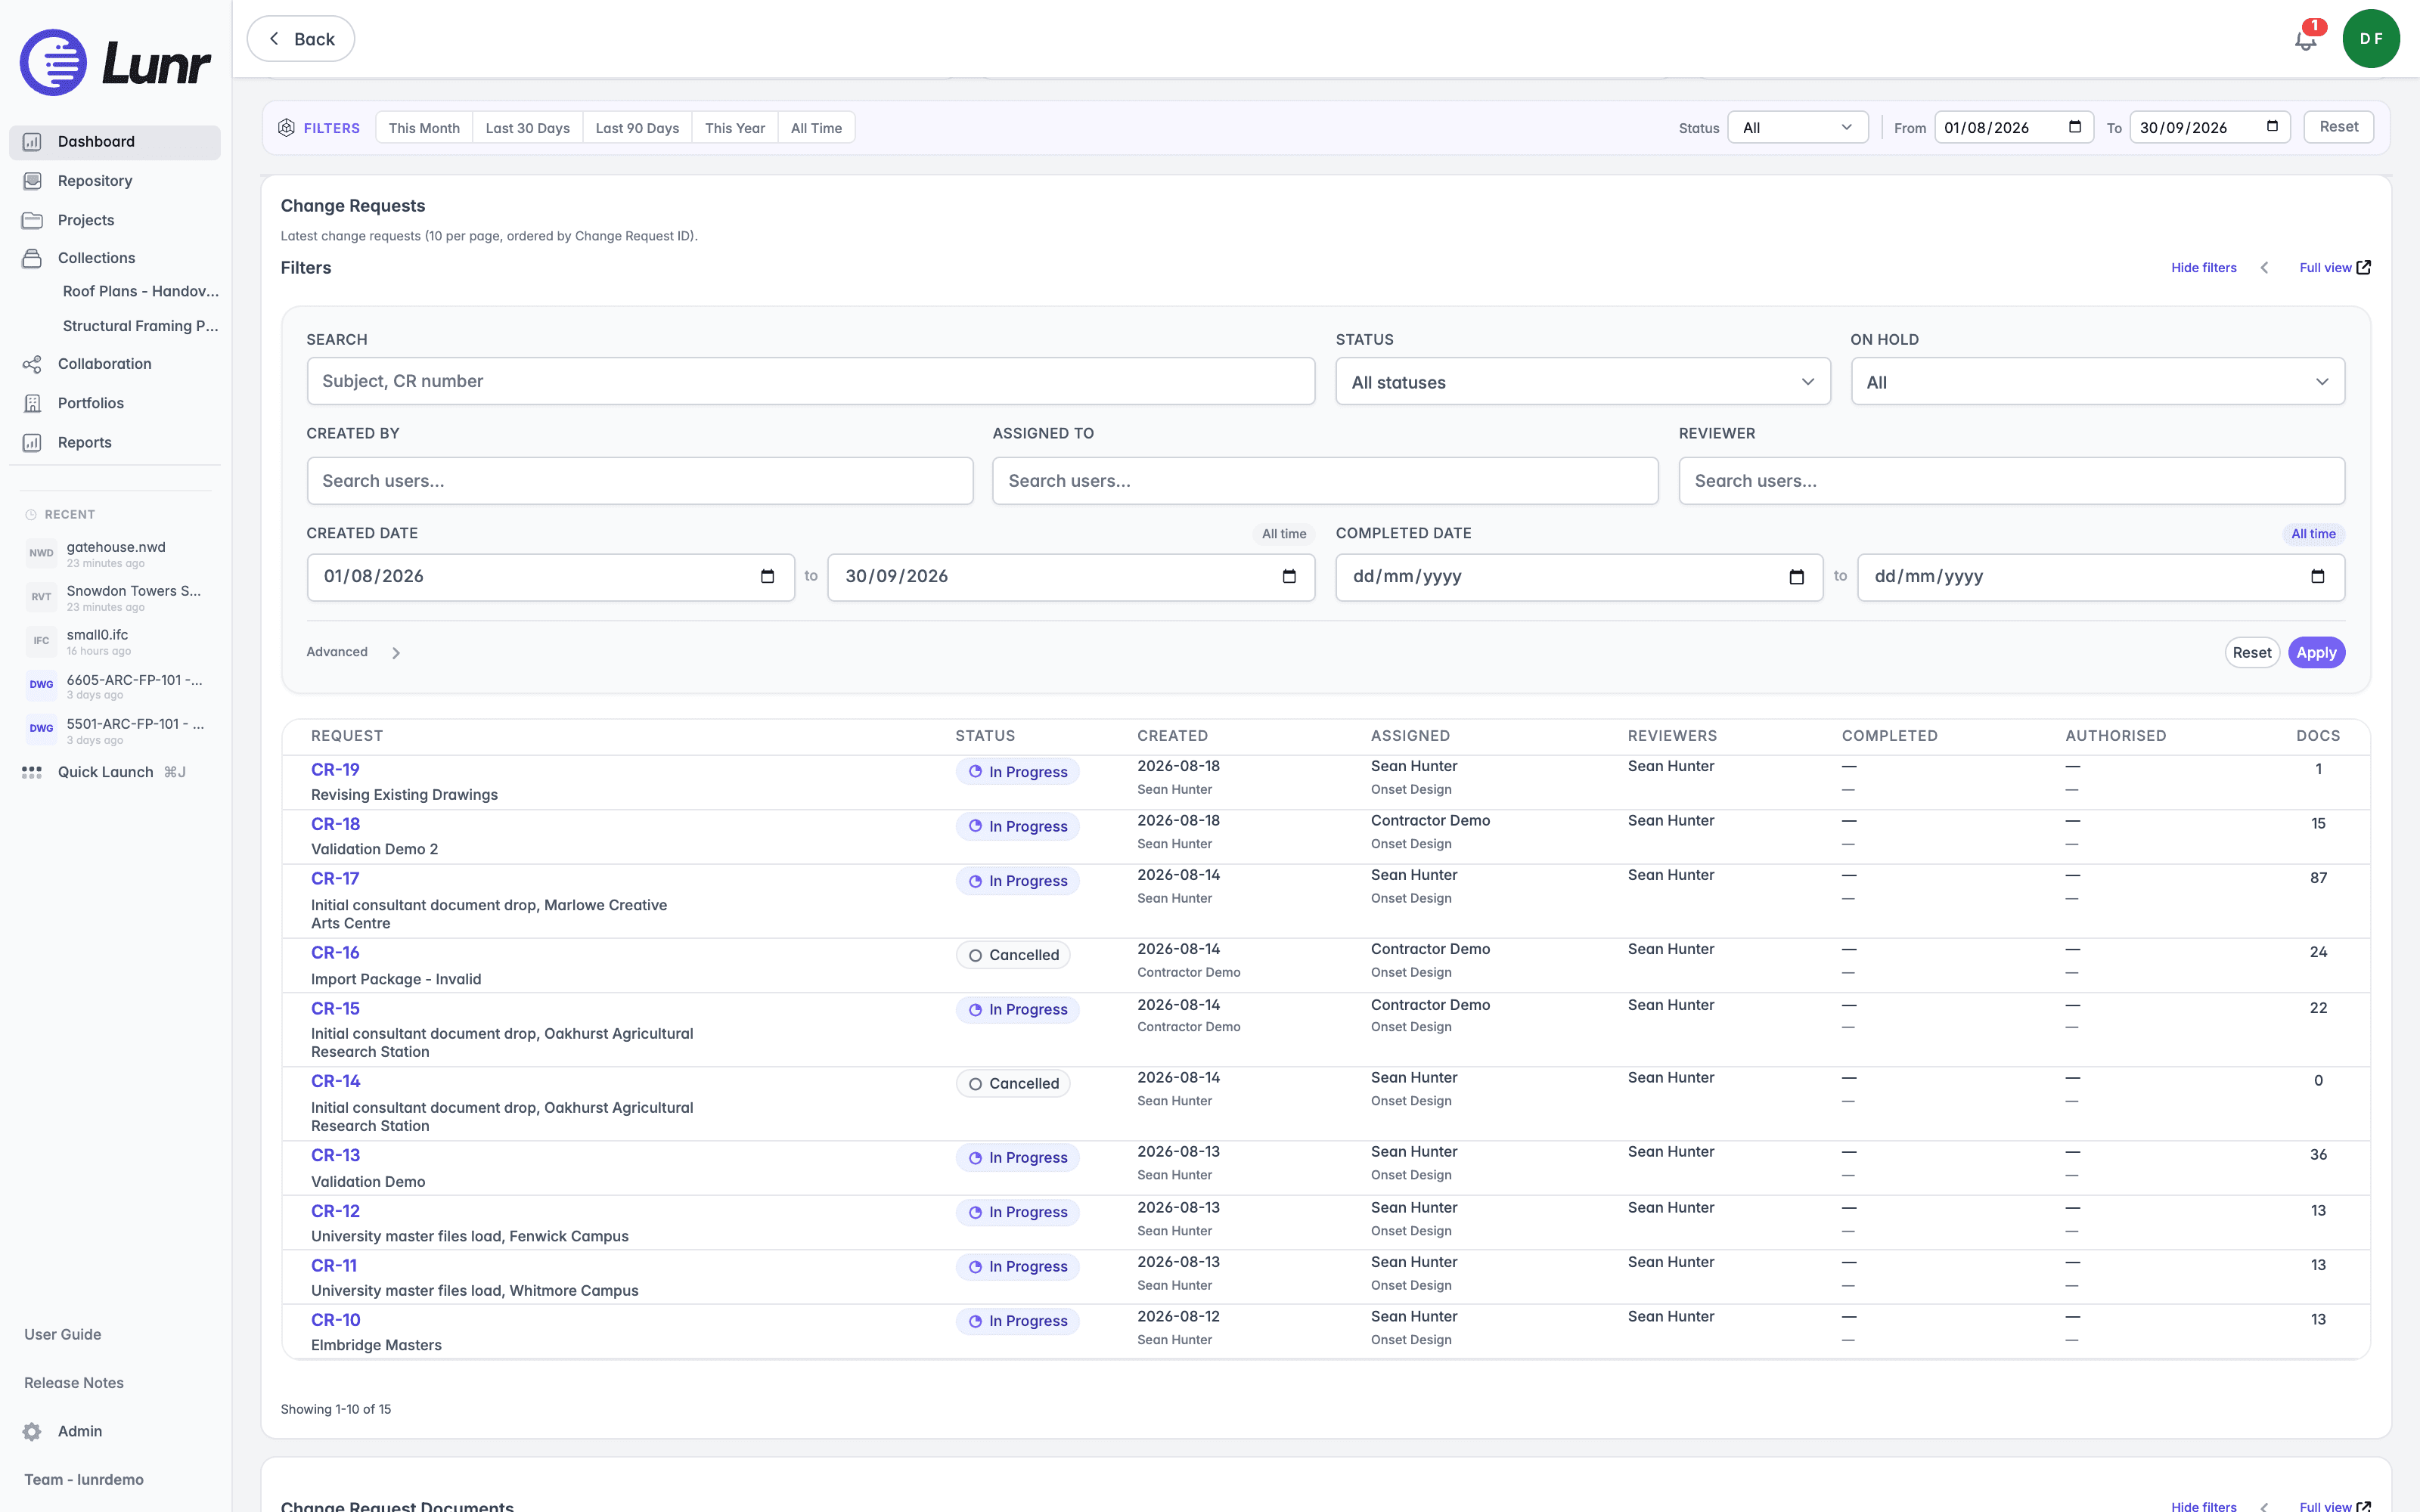
A Change Requests table follows, described as "Latest change requests (10 per page, ordered by Change Request ID)." A Filters panel offers Search, Status, Priority, On hold, Created By, Assigned To, Reviewer, Created Date, and Completed Date fields, with Advanced, Reset, and Apply buttons. The On hold choice is Exclude on hold or On hold only, and Reviewer narrows the table to the Change Requests a person is reviewing. Select Full view to open the full list in the Collaboration area. Its columns are Request, Status, Created, Assigned, Reviewers, Completed, Authorised, and Docs, with Reviewers listing one name per line and an On Hold marker appearing against a Change Request currently on hold.
A Change Request Documents table follows, described as "Latest documents across change requests (10 per page, ordered by Change Request ID)." Its filters are Search Request Drawings, Change Request, Workflow Status, Assigned User, Reviewer, Assignee Company, Tag, and Tag Value, the last reading "Select a tag to filter by value" until you choose a tag, with Apply and Reset buttons. Its columns are Document, Change Request, Assignees, Assignee Company, Reviewers, Workflow State, and Updated.
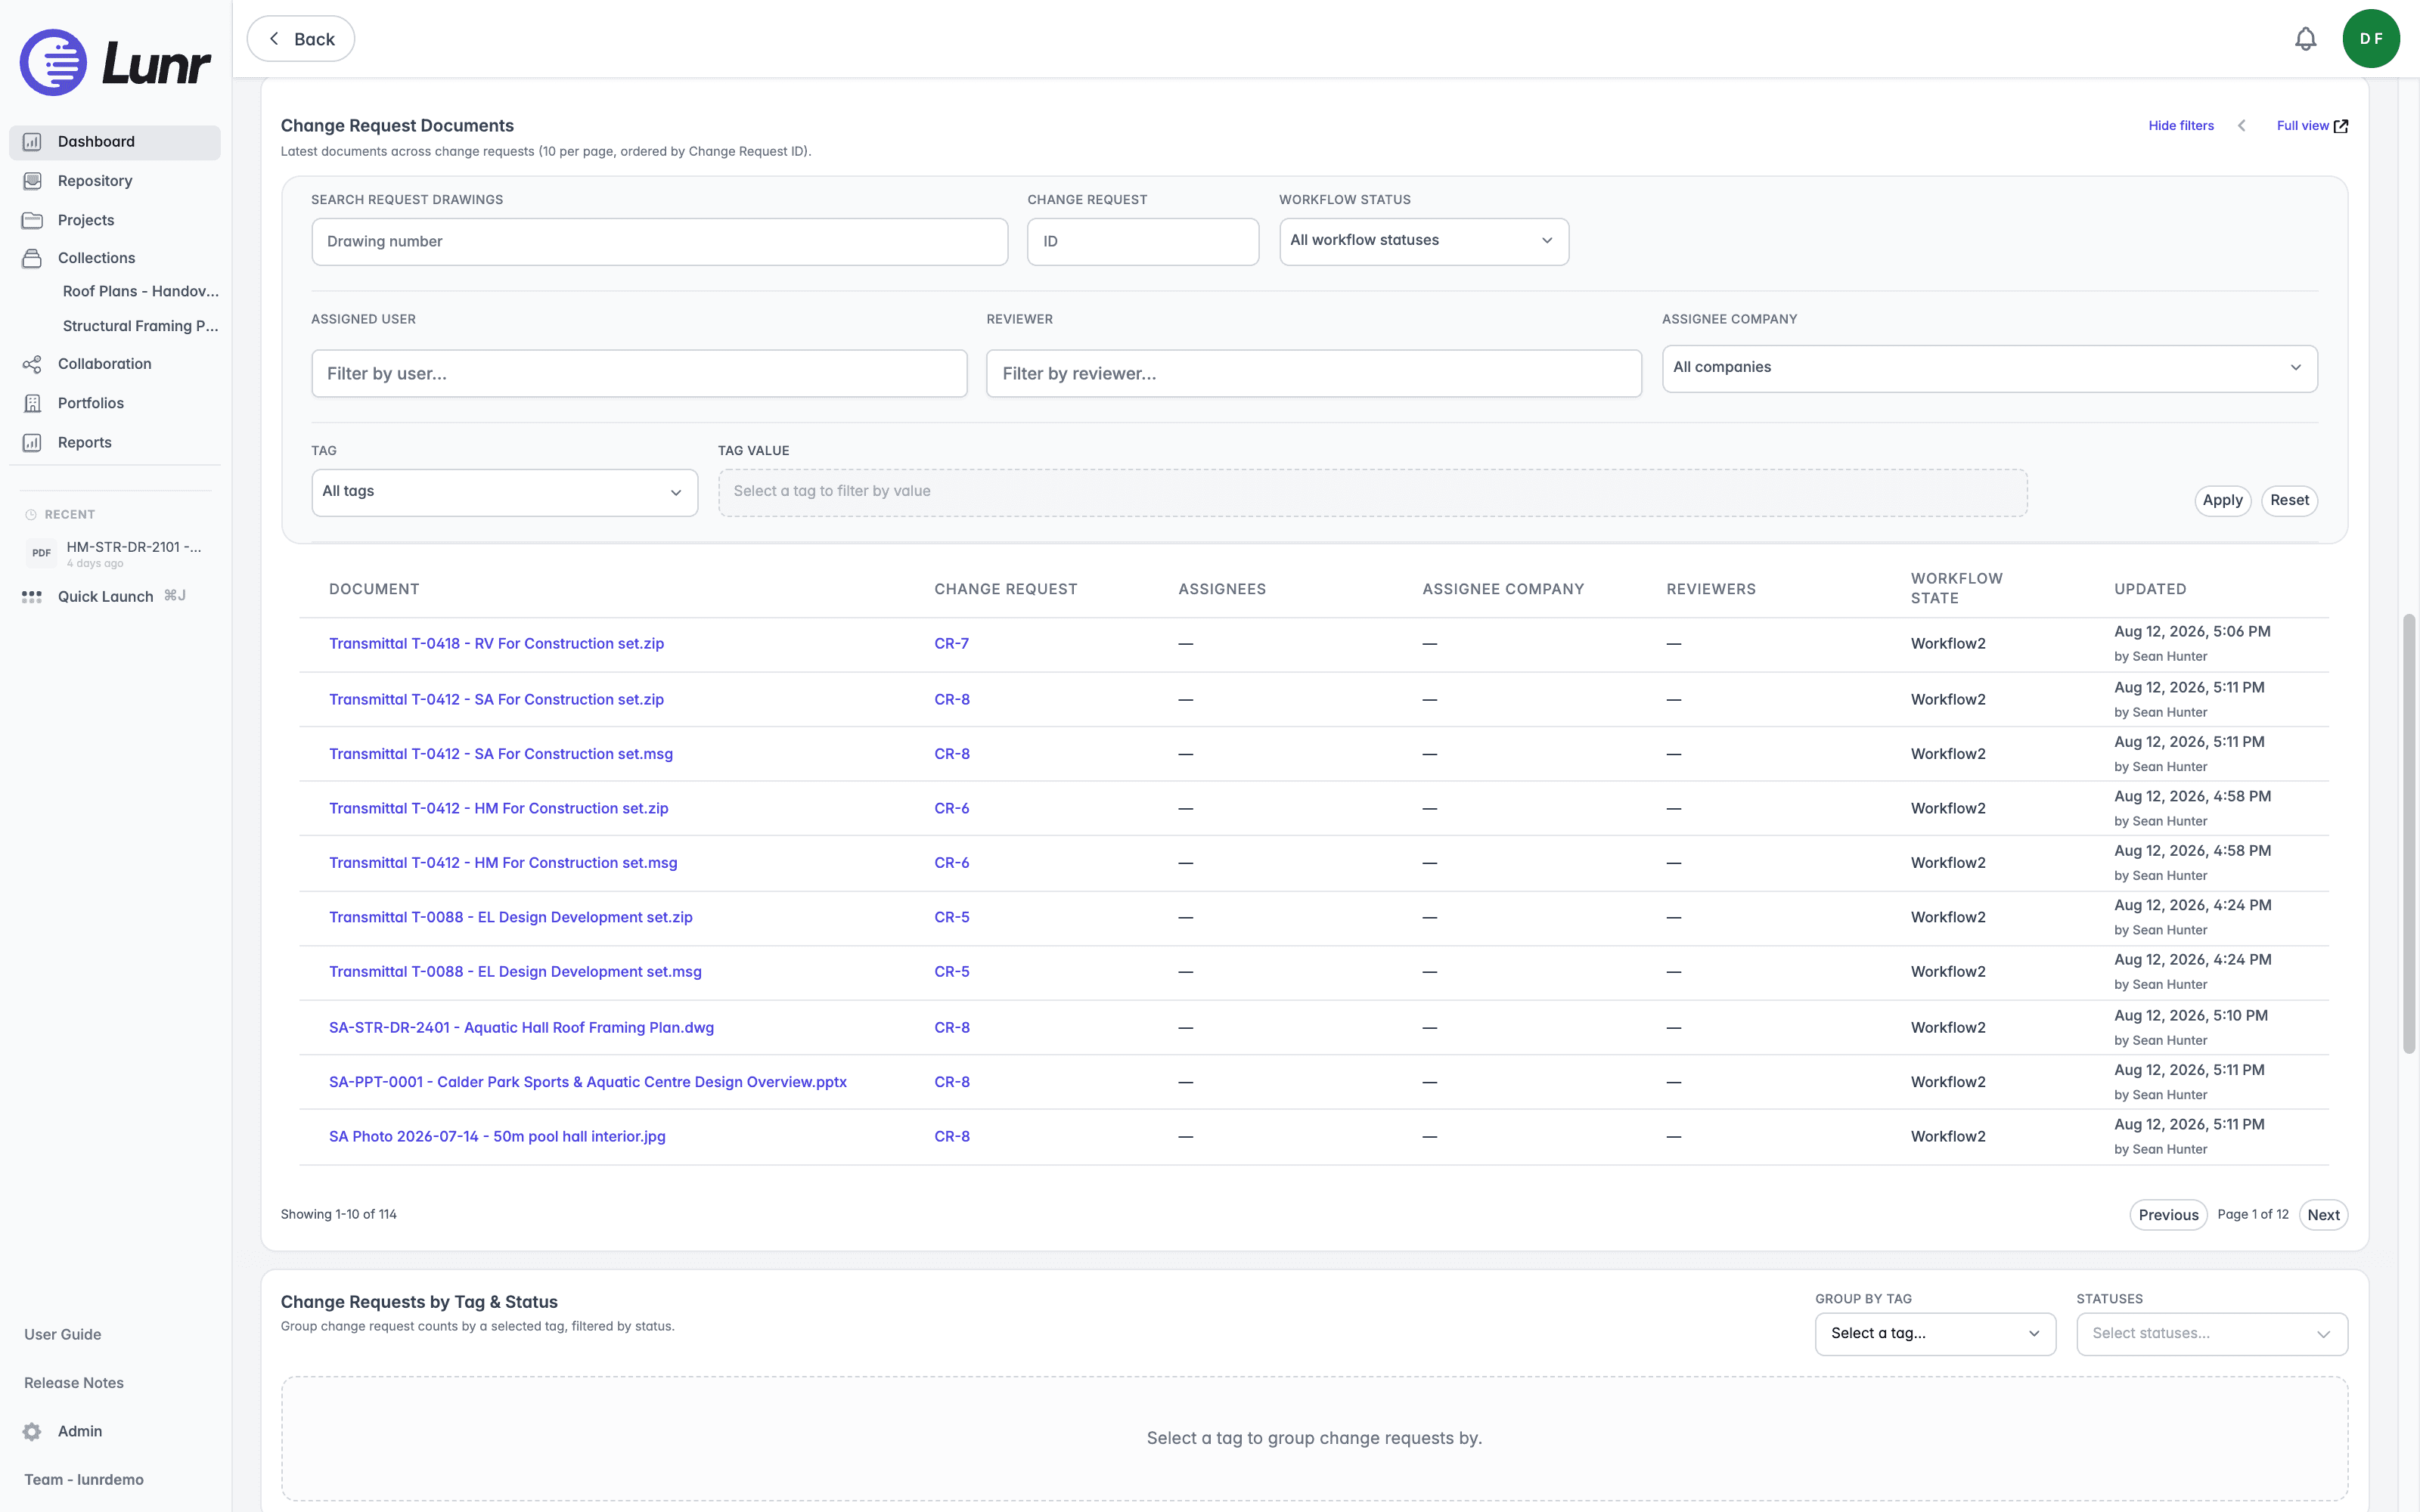
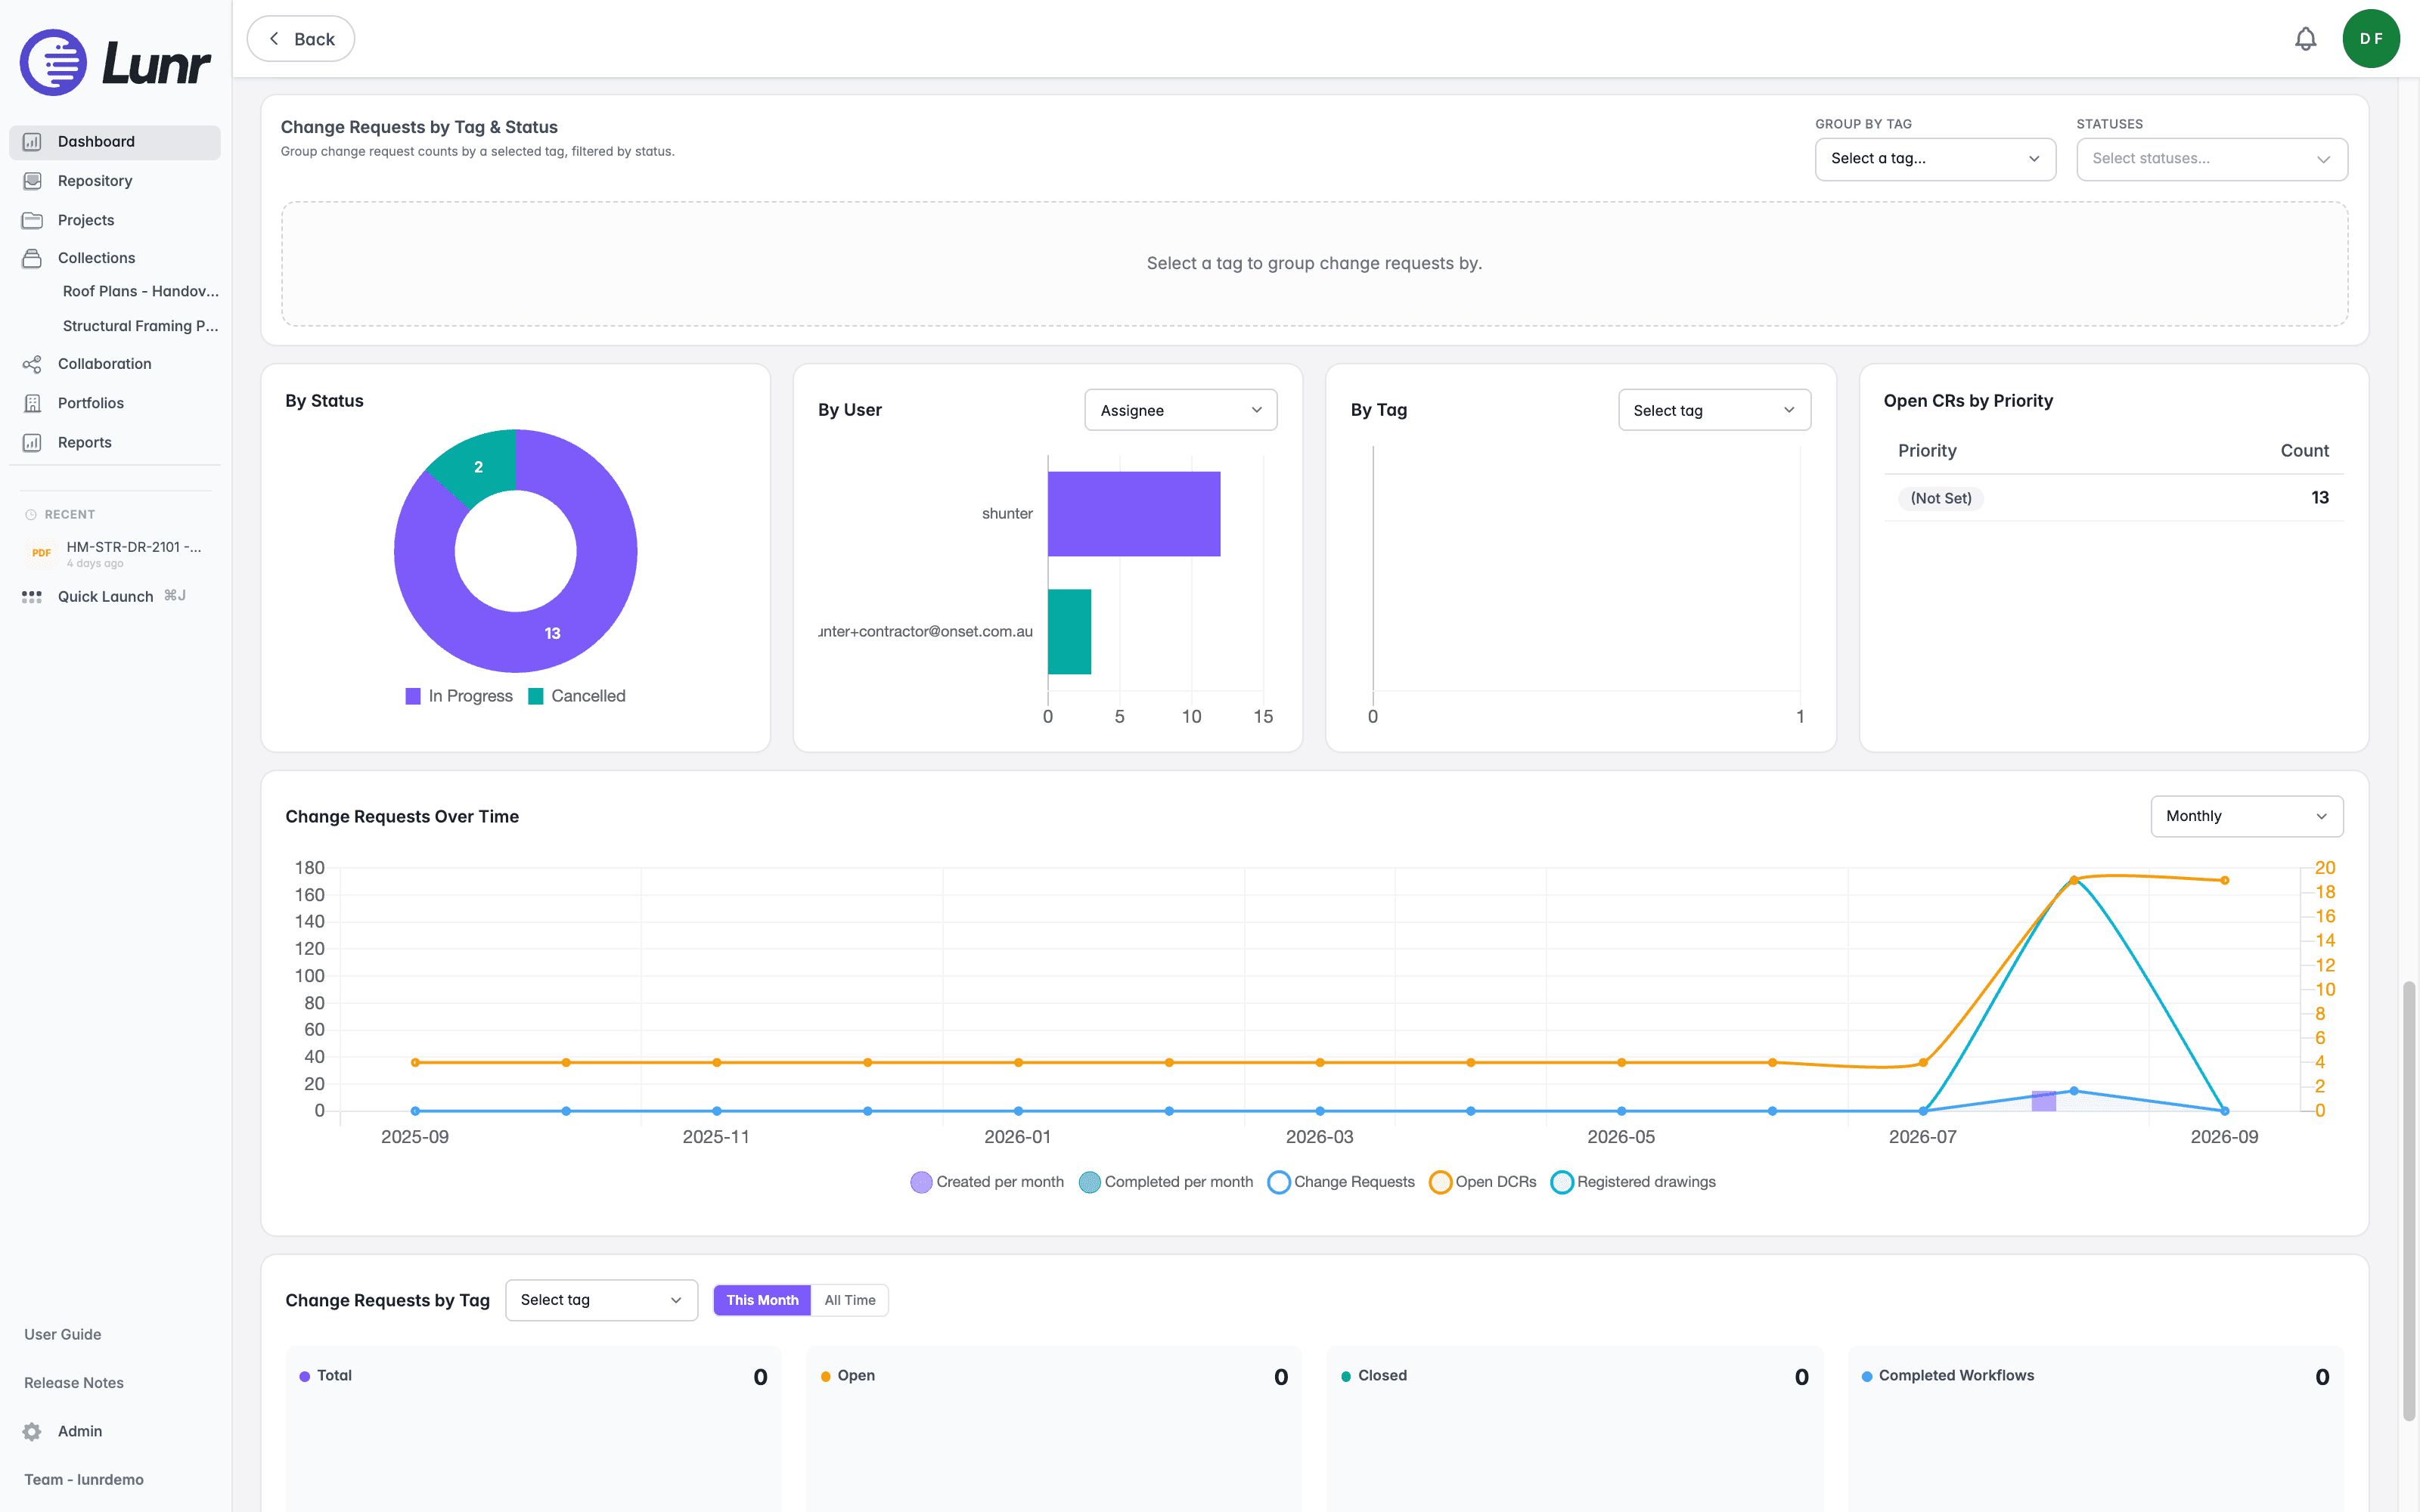
Change Requests by Tag & Status groups change request counts by a tag you choose, filtered by status, using Group by Tag and Statuses fields; it reads "Select a tag to group change requests by." until you choose one. By Status, By User (choosing Initiator, Authoriser, Assignee, or Completer), and By Tag charts follow, then Open CRs by Priority with Priority and Count columns.
Change Requests Over Time follows, which you can aggregate by Daily, Weekly, Monthly, or Yearly. Finally, Change Requests by Tag offers This Month and All Time buttons alongside Total, Open, Closed, and Completed Workflows figures.
A Document Queue tile appears if you hold the Manage Document Queue access right, listing change requests waiting to start on parent documents.
Customising the Layout
Select Customise to unlock the layout. The button becomes Done, and a Reset button appears beside it, which returns the layout to its defaults.
While unlocked, every tile shows size buttons S, M, and L, and Split, which moves the tile onto its own row. Point at a row to reveal its drag handle and the actions Move row to top, Move row up, and Move row down, and point at a tile to reveal Remove tile. Some rows, such as the KPI band, also offer Edit row and Delete row, and a few cannot be moved at all, including the Filters row on the Change Request Dashboard. Selecting Edit row opens a Configure Row dialog offering tile sizes Small, Medium, and Large, with Save and Cancel buttons.
Where your layout includes a custom tile row, an Add Tile action opens an Add Tile dialog. Give the tile a title, then choose a data type of Document, Change Request, or Workflow, a report type of Detail, Aggregate, or Total, and a style of List, Pie Chart, Bar Chart, Line Chart, or Count.
Select Done once you are finished. Your layout is saved to your browser, not your account, so it does not follow you to another computer.
Chart Drilldown
Select a segment of a chart to carry that value through as a filter on the rest of the dashboard. Status, user, company, priority, tag, and trend charts all support this.
The Avatar Menu
Open the avatar menu to reach your profile, downloads, reminders, and repository picker, follow the reminders waiting on you, switch between repositories, and manage your photo, contact details, multi-factor authentication, and preferences.
Introduction
Understand what the Lunr document repository holds, how tags file documents into its folder structure automatically, what each document carries, and which page to use to browse, search, or download.